


New publication out in Remote Sensing of Environment: “Global and boreal estimates of woody aboveground biomass for 2020: Filling GEDI’S northern data gap with ICESat-2 and harmonized Landsat Sentinel-2”
Abstract: Forest aboveground biomass Density (AGBD) maps provide important constraints on climate and carbon cycle models and enable the long-term monitoring of carbon stocks. NASA’s latest spaceborne lidar instruments provide unprecedented observations of forest structure that are used to compile spatially continuous, locally trained maps of circa 2020 AGB density and stock. To address a geographical limitation of the International Space Station deployed GEDI instrument, herein we map high northern latitude forests with a fusion of NASA’s ICESat-2 mission, Harmonized Landsat Sentinel-2 (HLS), and Copernicus GLO-30 topographic data. We report a domain-wide estimate for boreal forests of 72.96 +/− 0.61 Pg AGB. Combining these maps with those of tropical and temperate forests from GEDI products provides a global estimate of 2020 biomass stocks of 593.49 +/− 13.3 Pg AGB. We analyze biomass means and totals across the boreal domain in different land cover types, slope classes, and ecoregions. We compare these products to national estimates of AGB stocks for high latitude countries, finding good general agreement between national reports and EO-based estimates, particularly for countries with robust National Forest Inventories (NFIs) and boreal forests, while underestimation of high AGBD in tall, dense forests remains a challenge for AGBD mapping. Satellite products can be used to support wide area estimation of aboveground biomass, and the maps described here provide insights into carbon stocks, patterns, and dynamics at scales relevant to forest management. These open access data products serve as a baseline to assess future changes associated with drought, fire, insects, deforestation, and degradation.
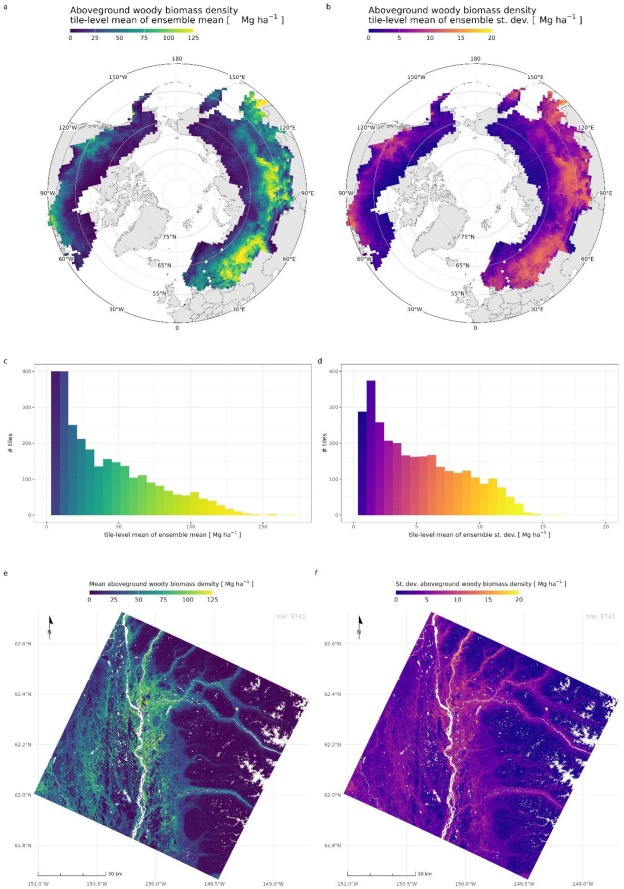
Map of 2020 aboveground biomass density (a: mean) and its uncertainty (b: standard deviation) for the boreal domain using the ensemble aggregations at the tile-level from 250 bootstrapped predictions for the circumpolar boreal domain. Histograms (c, d) correspond to these aggregations. The 30 m data was aggregated to means for each tile90 for display. Examples of a pixel-level map for a single 90 km × 90 km processing tile of 2020 AGBD mean (e) and standard deviation (f). At this scale, detailed forest structure patterns associated with hydrology and disturbance history, and the results of landcover masking, are apparent.
Read the full article here!